At around this time last year, I was being flooded with various articles on new year's resolutions and yearly summaries - as is typical in early January. I was trying to decide whether there is anything I hoped to change in my life. One of the big points on my 'roadmap to becoming a better human' google doc (everyone has one, right?) was being more aware of what happens with my time (what do I spend it on? am I sure I'm making most of it?). This sounded like an actionable new year's resolution, so I decided to give it a try. However, I tend to get a bit intense sometimes and so I kind of logged all my activities at 15-minute intervals for the whole year.
You did what!?
I logged my activities at 15-minute intervals for the whole year.
Here, check out this screenshot from my google sheet (btw, the spreadsheet title is just "Life"):

Why would you do this!?
I wanted to see what happens with my time. I knew I was spending quite a lot of it on social media, but I wasn't sure how much exactly. I also knew I was working quite a lot and wanted to quantify exactly how much (spoiler alert: not that much). I hoped that keeping track of what I do would help me to identify chunks of time that were being wasted and to turn them into quality time.
It was also a purely scientific curiosity - there were many less important questions that I was curious to find answers to: do I get less sleep while at uni? How much time do I spend with people vs on my own? What are the effects of drinking alcohol? and many others.
Ok, sure, whatever. How much effort did this take?
Not that much actually!
When I started, I was fully expecting to get bored with the whole thing and stop after maybe a month or so. Surprisingly, logging what I do turned out to be quite easy. As you might have noticed, I get quite excited about data so seeing my spreadsheet getting bigger and more colourful was enough of an incentive to keep me going. In the few instances, when I came close to stopping, a strong FOMD (fear of missing data) would always get me back on it.
Technicalities
I don't care, I want to see the data.
- I decided to log my activities in 15-minute intervals - I wanted to be able to catch shorter activities (especially procrastination) but didn't want it to be too crazy (though I might have lost the right to decide what is crazy when I started the whole project)
- I was using google sheets to log my data. I liked them because are online by default allowing me to log my data both on my laptop and my phone, the drag-to-copy cell content function makes it easy to log longer activities and the conditional formatting makes the spreadsheet nice and colourful providing instant gratification. You can access my template here.
- I divided my activities into broad categories to make noting them down easier. Some categories were divided further into subcategories.
For me, the categories were:
- sleeping:
- focused work - what I really understand as productivity:
- uni - university (until June) and PhD (since October)
- self-improvement - job applications, but also working on my personal projects (like writing code to analyse my data, or learning to draw)
- admin - answering emails, filling forms etc (btw filling my time tracking spreadsheet was in this category)
- organising - things like organising events for a society, conferences and other extracurricular things
- German - to track language learning
- low-focus work - same subcategories as in focused work. Low-focus work included activities that were more mechanical and didn't require too much brain power. For example, admin or organising my notes would be low-focus, while reading papers or writing essays would be focused work.
- socialising
- culture (with subcategories: books, films, documentaries, TV shows, and other)
- human function - the boring stuff I need to do to stay alive (showering, making food, eating and things like that. On trips also setting tents etc)
- other quality time - things that didn't really fit into the other categories. Subcategories: blogs, podcasts, news, games, YouTube, chilling (for the times when I needed to just lie down or stare at the wall), and other)
- travelling - time spent in buses/cars/planes etc
- exercising - deliberate exercise - running, cycling, exercise routines
- exercising (lower intensity) - mostly walking/slow cycling, but also stretching
- procrastinating - mostly social media
- idle - waiting in queues etc
The data
Alright, so now that I hopefully managed to calm you down, let's use the data I have to answer a few questions:
What did I do in 2020?
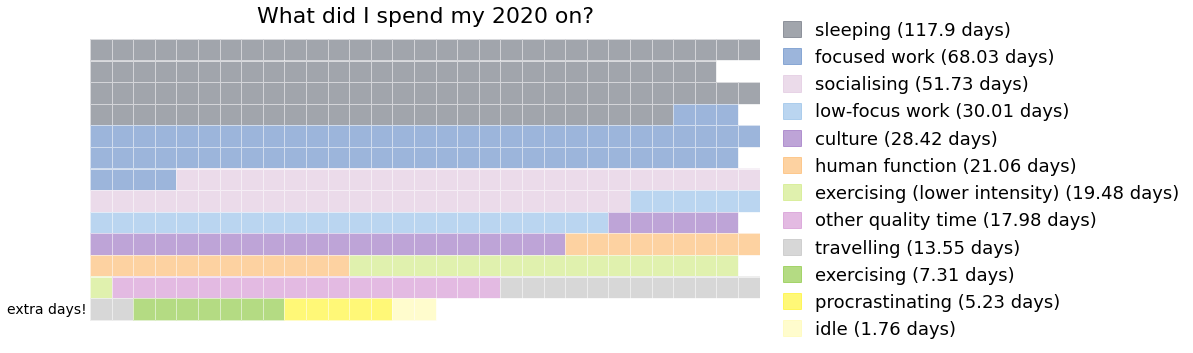
Turns out my top three activities of the year are sleeping (7h 45min on average per day and I'm very proud of this), working (6h 20 min on average per day) and socialising (3h 25 min on average per day). It is mostly what I would expect except that it always scares me how much time we actually spend unconscious. I can't decide whether 1h 20 min spent on human function (eating and showering etc) is a lot or not (a downside of a small sample size, I guess). On one hand, I could probably use that time to do more fun things but on the other hand maybe I should just chill. The procrastination time (on average 10 mins per day) is definitely less than it actually is - I will talk more about it in the productivity section below.
Another cool feature of the way I was logging my data was that I could log more than one activity into a single time slot (walking and listening to a podcast is a classic). This means that the total time spent on all activities sums up to more than 365 days - you can see this as 'extra days' on the plot above. Turns out that this year, I had 395 surplus hours or 16.5 surplus days. I hope I didn't spend them on human function.
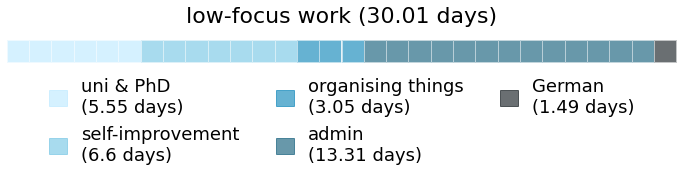
Some of the categories from the plot above were divided into more helpful subcategories:
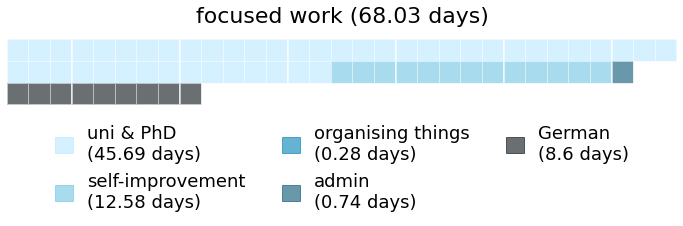
By far, most of my work was towards uni and PhD - 51 days in total. After excluding the time from June to September, when I had holidays, this gives around 5hrs of work per day. While this includes weekends, this does not seem like a lot, especially that weekends are not really well respected at uni.
Finding out how little focused work I do, even on the days that feel productive, was one of the biggest surprises of analysing my data. It turns out that a typical working day (9-17) would usually only give around 5-6 hours of actual work, while the rest of time would dissolve on low-focus work, chatting to people, coffee breaks and other little distractions. While there were days when I would reach 8 hours of focused work (for focused uni work I had 32 such days this year), they required either spending the whole day (9-22) working or a lot of effort to stay focused. Both were quite tiring and unsustainable in the long run. I guess the lesson here is that when it comes to focused work, the 8-hour working day is an unattainable target and should not be used as a benchmark.
I also do a lot of admin - nearly half of all the time I spend on culture. This is fairly sad and a potential action point for the future.
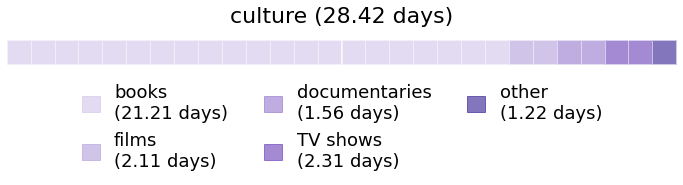
I spent a fair amount of time reading books - nearly 1.5h per day on average! I'm quite happy with this since this is a habit I consciously worked to develop this year. During this time, I have read 35 books (12,715 pages according to Goodreads 1 ). If you want some recommendations, my top three would be: A Gentleman in Moscow, The Places in Between, and Little Fires Everywhere. On the other hand, I can't really find films or TV shows that I would really get into, so if you have any that you love, let me know! Also a bonus: the 'documentaries' are really just Louis Theroux and I don't regret a single minute.

How did the time spent on different activities change over the months?
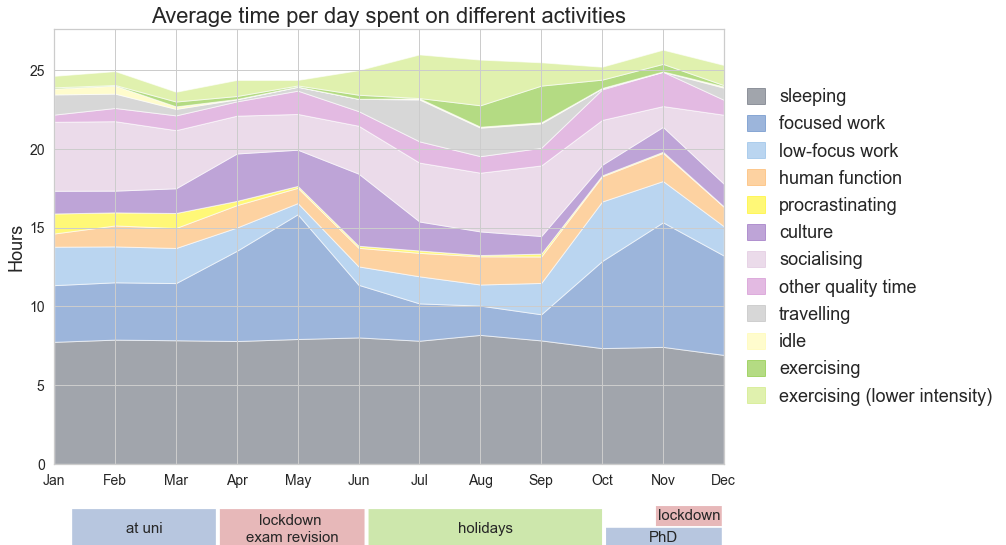
As above, the hours sum to more than 24 because of logging two activities in a single time slot if I was doing them simultaneously.
You can quite clearly identify the 'hard lockdown' times - April+May and November. In both periods, there is a noticeable increase in working hours, reduction in socialising and increase in culture. In the spring I was finishing my Master's thesis and revising for my exams so I would expect the increase in productivity regardless of lockdown. However, seeing the same pattern in November (when we were discouraged from coming to office) seems to suggests that I am actually working more when working from home. This is probably due to both fewer distractions but also to the lack of alternatives. Normally, I would often stop working to meet friends. During the lockdown, when this is not an option, I often just continue working.
I would love to talk about all the other categories, but the post is getting quite lengthy so you can explore them here (another bonus: look for my binge of playing Zoo Planet):
Hacking my monkey brain to increase productivity
As I was analysing at my data throughout the year, I was quite disappointed in how little I worked and was looking for a way to increase it. Inspired by this post I decided to gamify my productivity by giving myself points for activities I wanted to do more of. I was hoping that they would act as sources of instantenous pleasure for my monkey brain (which wants fun now and doesn't really care about future me) to make it do things that might be less fun but beneficial in the long run. Given that I already had data on my activities throughout the day, assigning points was pretty straightforward.
I would get:
- 4 points per hour for the most productive activities (focused work towards uni & self-improvement and exercising)
- 3 points for reading books
- 2 points for reading blogs, listening to podcasts, lower intensity work etc
- 0 points for things that are important but I do them anyway (socialising, sleep etc)
- -4 points for procrastination
And here are my points for this year:
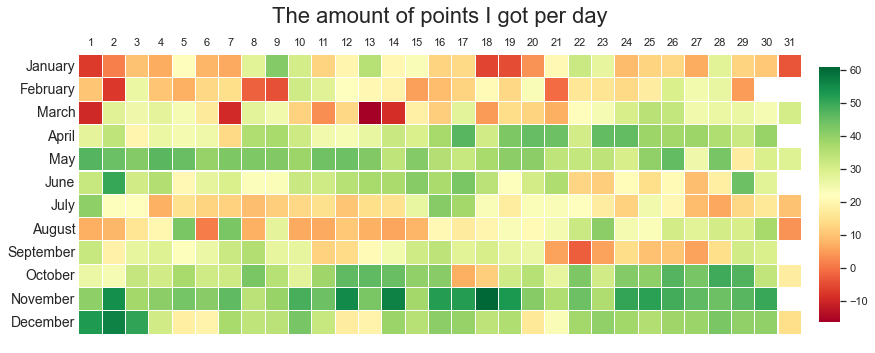
and their distributions throughout the months:
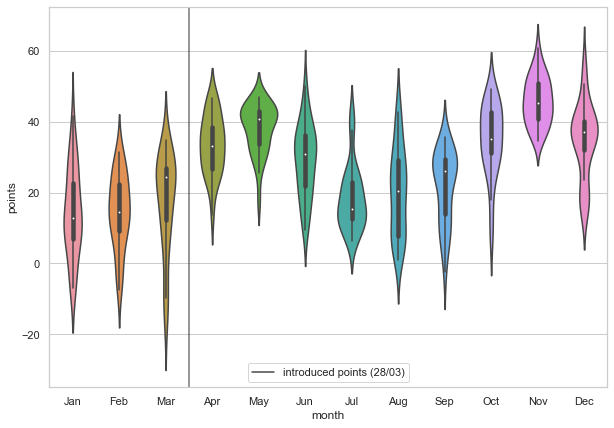
Turns out my monkey brain is
This is already pretty cool, but the most important outcome of introducing these points is that I stopped thinking about productivity in binary terms. Before the points, whenever I was too tired to do work, my thinking process would go like this: "Since I'm not doing work (bad), I might as well scroll some social media (also bad)", while after the points this became "Alright, I am too tired to do work (not gaining 4 points) but maybe I can read a book (3 points) or go for a walk and listen to a podcast (3 points) instead"
Of course, there are some caveats. Remember how I was unconvinced about the very low procrastination times? Since I started scoring myself, my monkey brain had a high incentive to find ways around logging in procrastination. I have frequently caught myself making sure that I only spend 5 or 6 minutes on Facebook so that I didn't reach the threshold of 7 minutes for logging in an activity in my spreadsheet. Sadly, I don't have any other source of data on how much time I was spending on social media to verify the accuracy of my tracking.
Another important consideration is that 'hours spent on' is not a great measure of productivity - I want to achieve things and not just spend time doing busywork. To make sure that this is the case, I do weekly summaries, where I compare what I wanted to accomplish vs what I actually did accomplish in the past week and plan for the upcoming week. However, for many activities, the points work well enough (a longer walk is more beneficial than shorter walk). And as for working, there is still some merit in making sure I do at least x hours of work per day - if I manage to accomplish something after 4 hours, I can still read a paper or do some less focused work.
Final thoughts
Lessons learned
- Logging a full year of activities is apparently possible?
- I work less than I thought I did and that's ok
- I'm much more productive when working from home
- Giving myself points for activities is an incredible life hack. Turns out that getting some non-existent tokens is enough of an incentive for me now to do things that me from the future wants done. I want to experiment with this a bit more (what happens if I give myself points for spending time with people? or for going on walks?)
Should you also track your time?
... I don't know? Do you want to? Personally, I found it fun and rewarding but you might not.
Coming soon
I. Have. So. Much. Data. (over 35k data points) This post barely scratched the surface. Stay tuned to learn how do different activities influence my mood, how important was spending time with people, whether lockdowns made me less unhappy and much more!
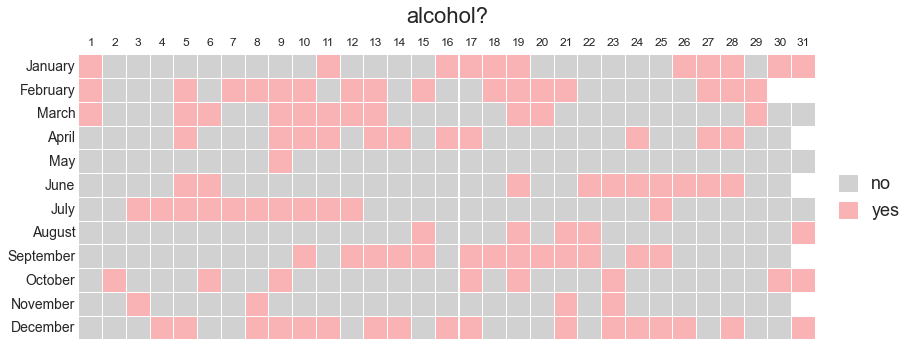
Bonus plot
Resources:
Grab the template I used to log my data.
1. A quick calculation (12715 pages/(508hrs of reading * 60 minutes/hr)) suggests that I've been reading with the speed of 0.4 page per minute. Apparently, on average, books have 200-300 words per page and a typical reader reads around 200-250 words/minute. My reading speed seems be within the expected order of magnitude, though quite slow. This might be because the page count does not include books which I started and didn't finish. Another potential explanation is that I've been overreporting reading. ↩